6 Apache Kafka Use Cases, and When You Do Not Need Kafka
Most teams do not adopt Kafka because they measured a need for it. They adopt it because a design document said "event-driven", and Kafka is what event-driven looks like on a slide. A year later they are running three brokers, a schema registry, a connect cluster and a Flink job, to move about four hundred events a second that a Postgres table would have handled without anybody being paged.
Kafka is genuinely good at a specific set of problems. This article walks through six of them, what each looks like in practice, and the part the architecture diagram leaves out: the failure mode you meet in month three. It ends with the case for not running Kafka at all, because that is the right answer more often than the conference talks suggest.
TLDR
- Kafka is a replicated, partitioned log, not a queue. Almost every surprise below follows from that one fact.
- Ordering is per partition, never global. If you need per-customer ordering, the customer id has to be the key.
- Log analysis works because Kafka absorbs backpressure when your search cluster falls over.
- CDC is the most valuable and most dangerous: a stalled connector pins your Postgres WAL and fills the primary's disk.
- Event sourcing on Kafka means no point lookups and no easy deletes, which collides with erasure requests.
- If you have one producer, one consumer and no replay requirement, you want a database table or SQS, not a cluster.
Prerequisites
- Comfortable with the idea of producers, consumers and topics
- Some exposure to a message queue, even just SQS or RabbitMQ
- Basic SQL, for the change data capture section
First, the thing that explains everything else
Kafka is a log. Not a queue, a log.
A queue hands a message to one consumer and forgets it. A log appends messages to an ordered file, keeps them for a configured time, and lets any number of consumers read at their own position. Nothing is removed when it is read. Consumers track an offset, and that offset is the only thing that says where they are.
Three consequences fall out of that, and they are behind most of what follows:
Replay is free. Reset the offset and read history again. This is why Kafka suits event sourcing and why it saves you when a downstream consumer had a bug for six hours.
Ordering is per partition. A topic is split into partitions for parallelism, and Kafka only guarantees order within one. There is no global ordering unless you run a single partition, which throws away the parallelism. Messages with the same key land on the same partition, so the key choice is your ordering guarantee.
Retention is a policy, not forever. By default Kafka drops data past a time or size threshold. Treating a topic as permanent storage requires either infinite retention, log compaction, or tiered storage, and each of those has costs.
topic: orders
partition 0:  [ o1 ][ o4 ][ o7 ]      <- ordered within the partition
partition 1:  [ o2 ][ o5 ][ o8 ]      <- ordered within the partition
partition 2:  [ o3 ][ o6 ][ o9 ]      <- ordered within the partition

Across partitions: no ordering at all.
Same key always lands on the same partition, so key by the entity
whose order you care about (customer id, account id, device id).
With that in hand, the six patterns.
1. Log analysis
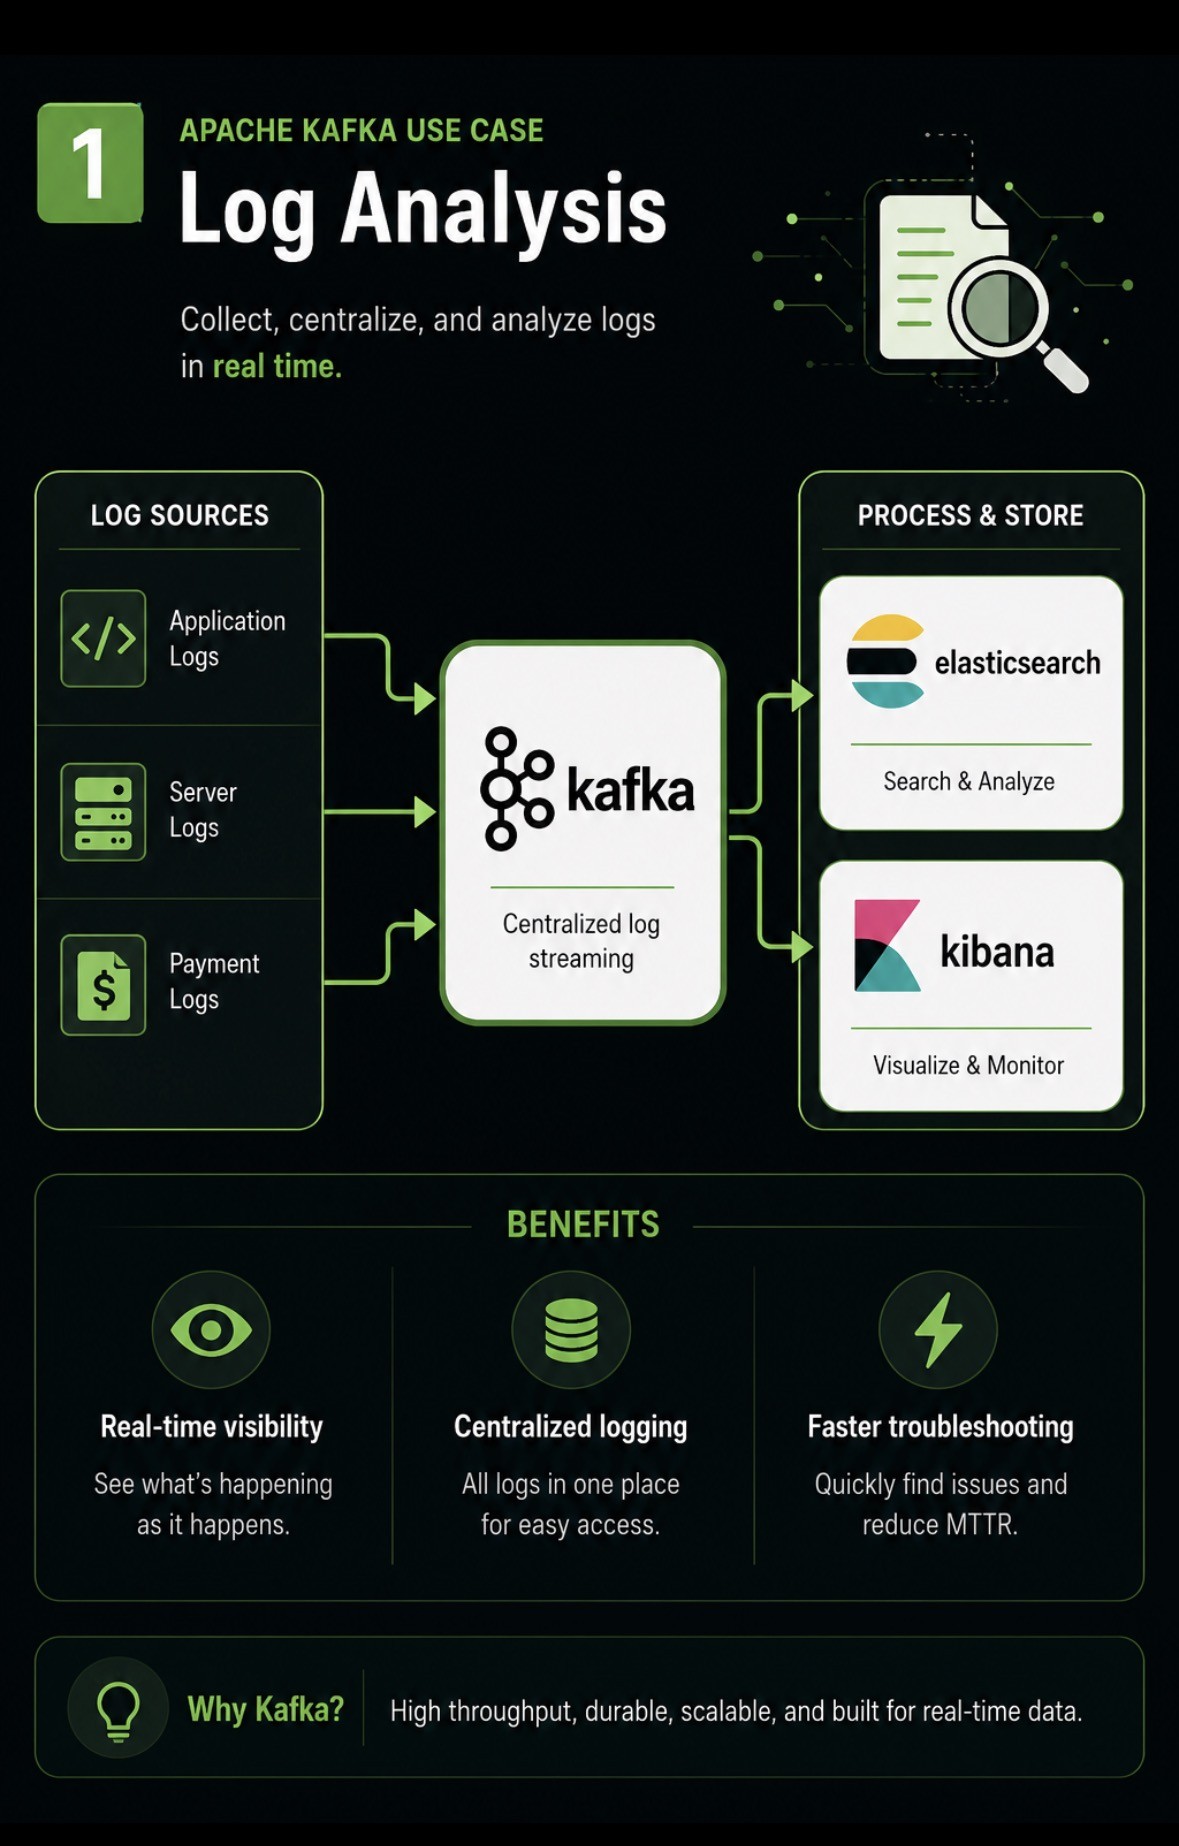
Application, server and payment logs land in Kafka, and Elasticsearch and Kibana read from it. Straightforward enough that it is worth asking what Kafka is actually adding, because a log shipper can write to Elasticsearch directly.
The answer is backpressure. When Elasticsearch slows down or falls over, direct shippers have two options, and both are bad: buffer on local disk until the disk fills, or drop logs. With Kafka in between, the shippers keep writing at full speed and the backlog sits in one place you have sized deliberately. Elasticsearch comes back, the consumer works through the lag, nothing was lost.
The second thing it adds is fan-out. Once logs are in a topic, adding a second consumer that ships a subset to cold storage, or feeds a security tool, costs nothing at the producer side. Nobody has to reconfigure two hundred hosts.
The failure mode: teams size retention for the happy path. Seven days of logs at normal volume is fine, until an incident produces ten times the usual log volume at the exact moment the consumer is degraded. Size retention for your worst hour, not your average day, and alert on consumer lag rather than on broker disk, because lag tells you the problem hours earlier.
Kafka is a buffer here, not an archive. If somebody asks "can we search last quarter's logs", the answer lives in Elasticsearch or object storage, not in a topic. Retention is measured in days for a reason.
2. Real-time ML pipelines
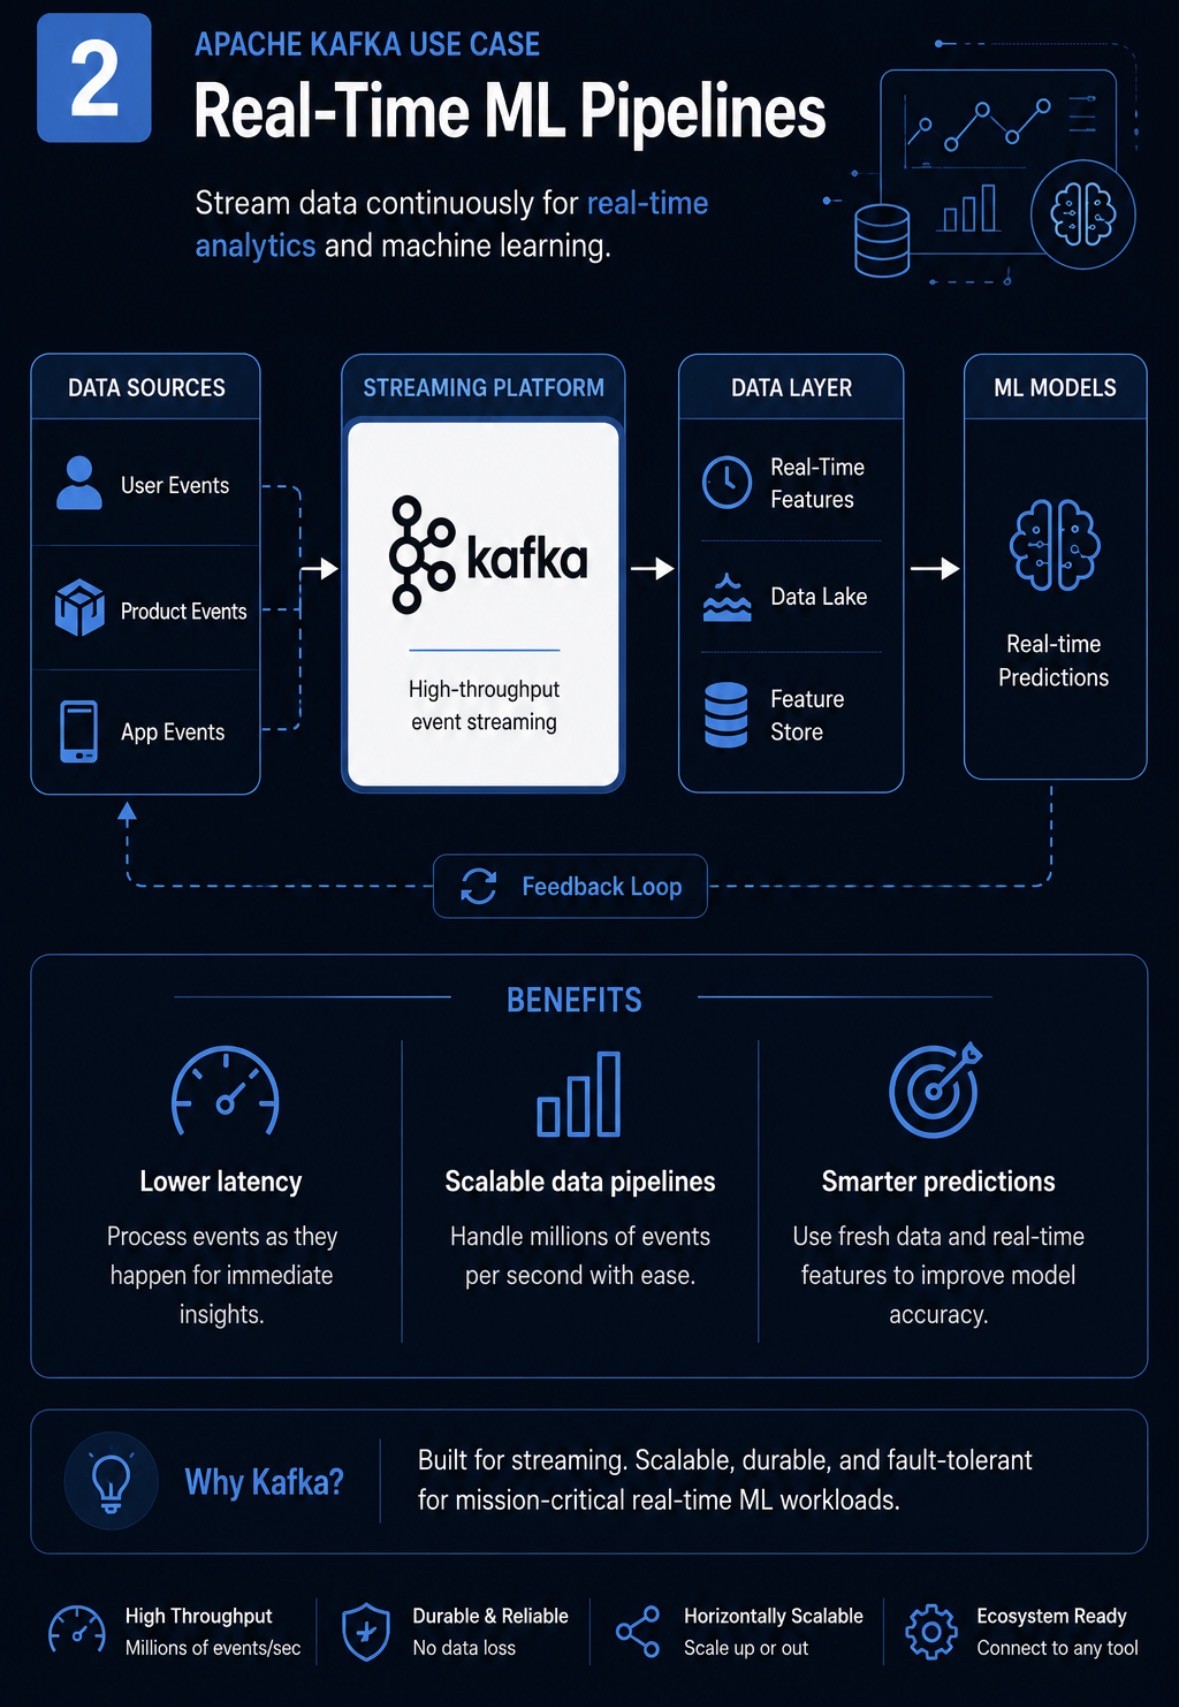
User, product and app events stream through Kafka into a feature store and on to models that score in real time. The interesting arrow on that diagram is the feedback loop at the bottom: predictions become events themselves, which is what lets you measure a model against what actually happened.
The reason this pattern needs streaming rather than a nightly batch is feature freshness. A fraud model that scores a transaction using yesterday's aggregate of the account's behaviour is scoring a different account than the one in front of it. "Number of transactions in the last five minutes" is not a batch feature.
The failure mode: training and serving skew. The features you train on are computed by a batch job over historical data. The features you serve are computed by a stream job. Two implementations of "average order value over 30 days" written by two people in two languages will disagree, and the model will quietly underperform in production while looking fine in evaluation. Every serious writeup of this problem lands on the same fix: define the feature once and compute it one way for both paths, which is most of the argument for a feature store existing at all.
3. System monitoring and alerting
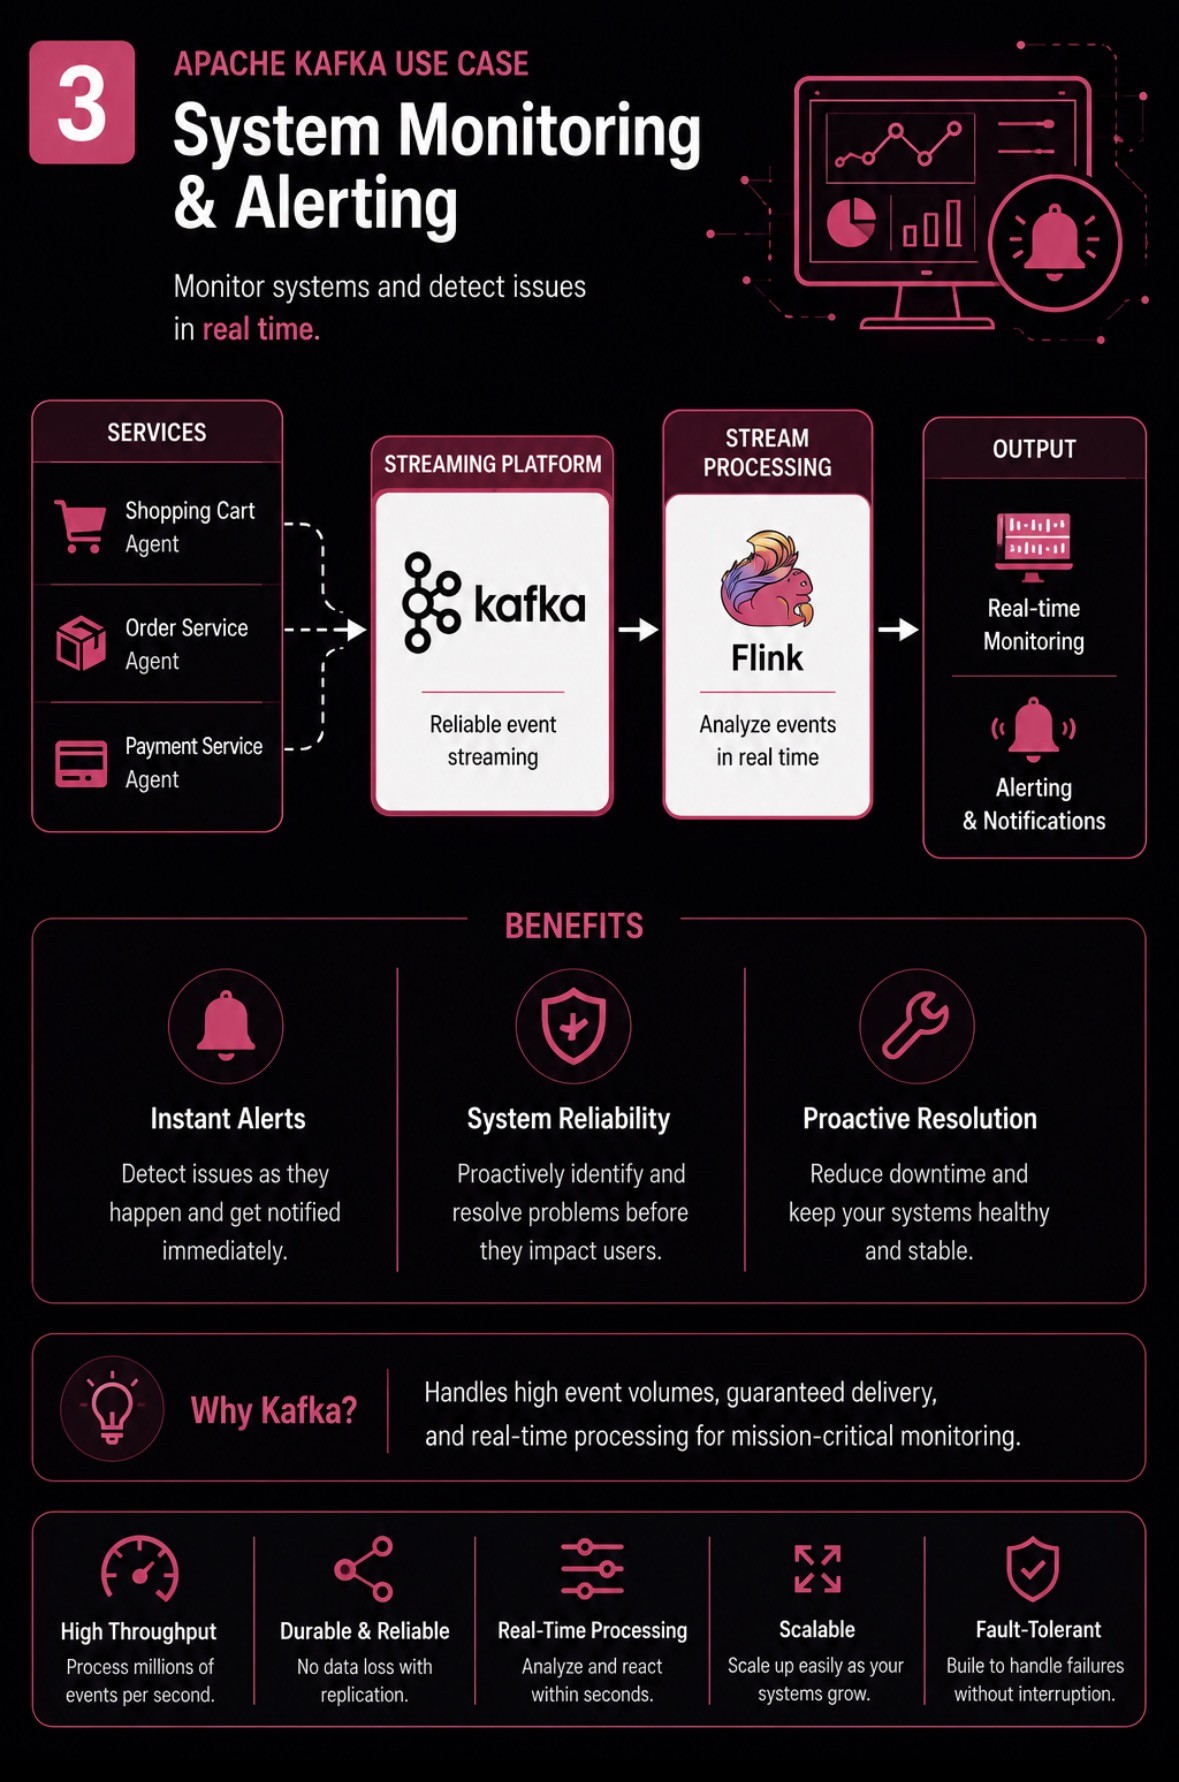
Services publish events, Kafka carries them, Flink analyses the stream, alerts come out the other end.
Before building this, be clear about what it is for, because it is not a replacement for Prometheus. Metrics systems are excellent at "CPU is above 90% on this host". This pattern is for alerting on business events in sequence: three failed payments from the same account inside a minute, a checkout funnel where the payment step stopped completing, a device that reported healthy then went silent for longer than its normal interval.
The distinction matters because those questions need windows and state. You are not thresholding a gauge, you are asking whether a pattern occurred across a stream of events in time order.
The failure mode: late data. Events do not arrive in the order they happened. A mobile client goes through a tunnel and delivers a batch of events ninety seconds after the fact. If your alert uses a one minute tumbling window on arrival time, those events land in the wrong window, and you get either a false alert or a missed one. This is what watermarks are for, and configuring them is a real decision rather than a default: too tight and you drop legitimate late events, too loose and every alert is delayed by the allowance.
event time:    10:00:05  10:00:20  10:00:45   (what actually happened)
arrival time:  10:00:06  10:02:10  10:00:46   (what your job sees)
                            ^
                    90s late, lands in the wrong window
                    unless the job groups by event time
Group by event time, not arrival time, and decide explicitly how long you are willing to wait for stragglers.
4. Change data capture
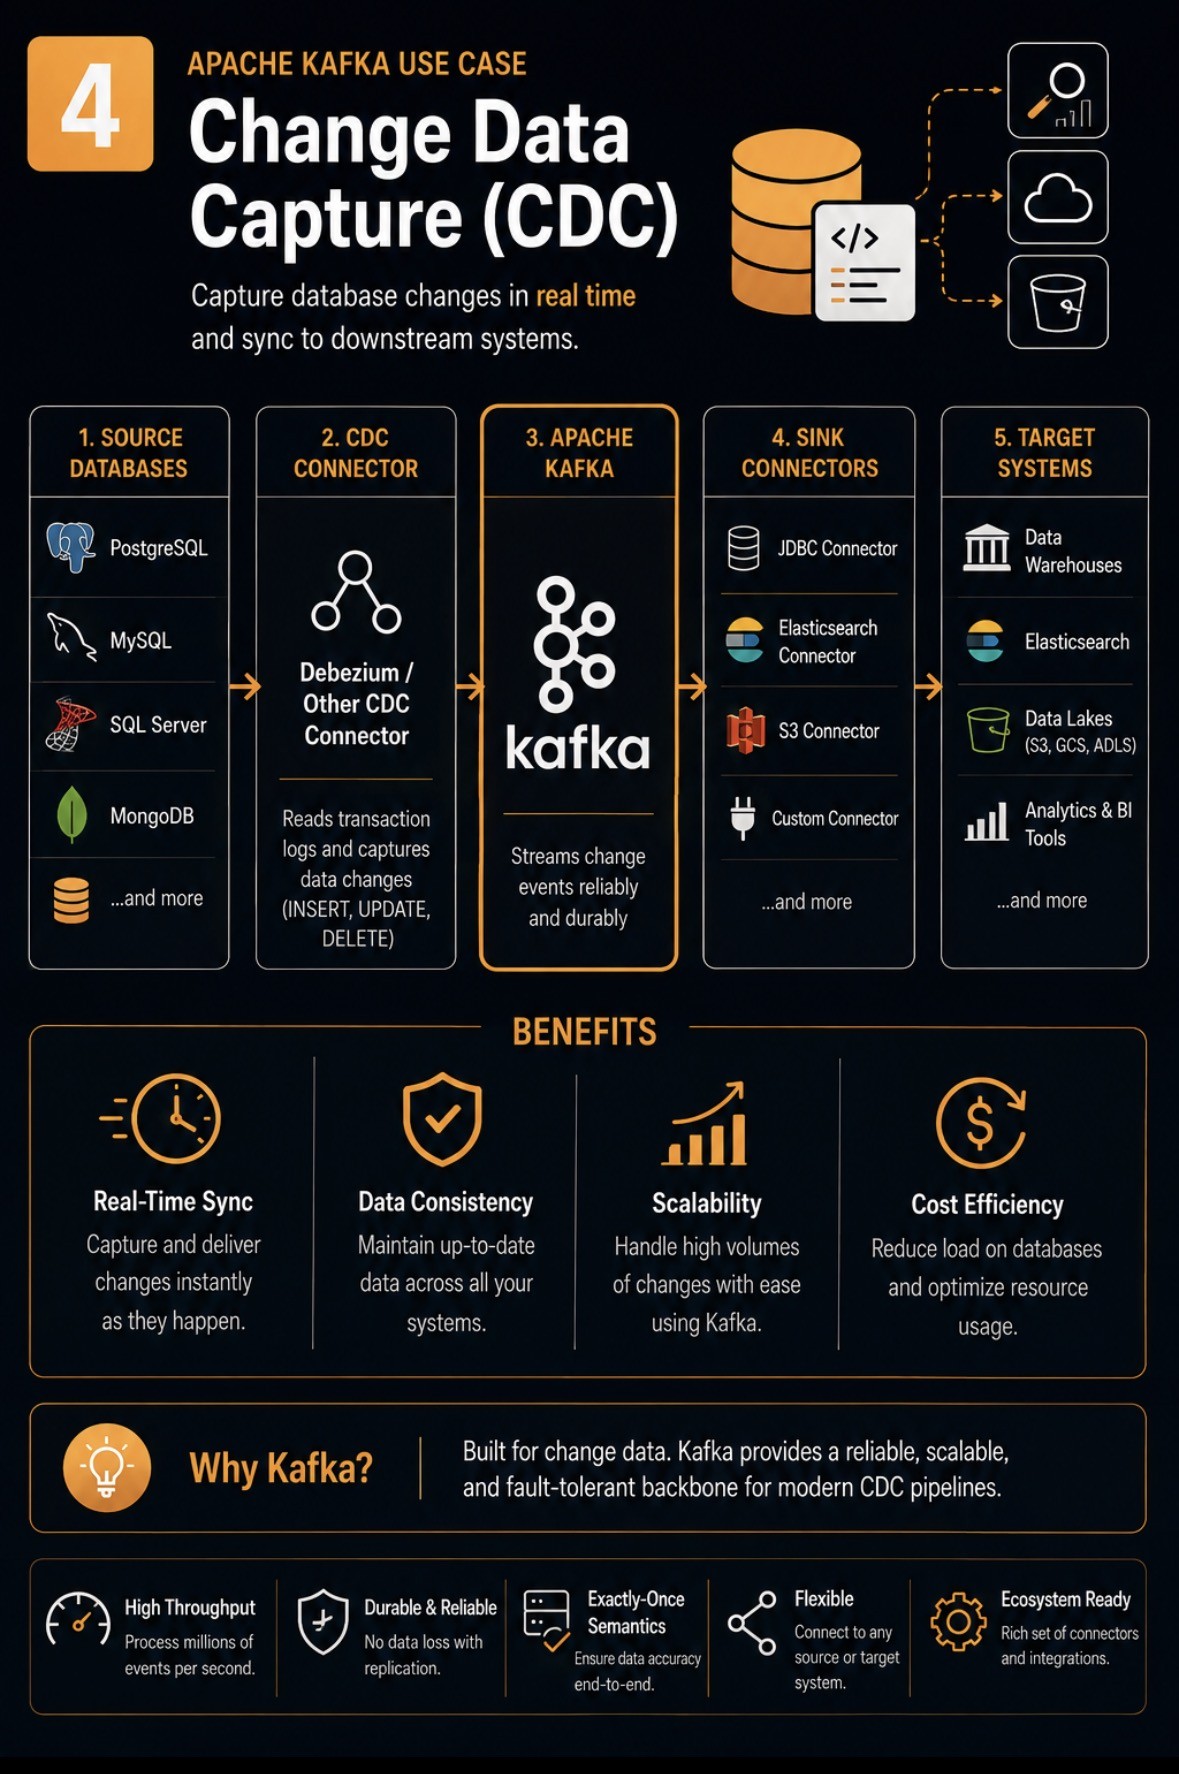
A connector like Debezium reads the database's transaction log and turns every insert, update and delete into an event on a topic. Sink connectors carry those to warehouses, search indexes and data lakes.
This is the pattern with the best return, because it solves the dual-write problem. Without CDC, keeping a search index in sync means your application writes to Postgres and then writes to Elasticsearch, and when the second write fails you have two systems disagreeing with no record of it. CDC removes the second write entirely: the database commit is the only write, and everything downstream derives from the log of commits. If a sink is down, it catches up.
Once change events are flowing, the next question is always how to query them, and hand-rolling a consumer that maintains a rolled-up view turns out to be much harder than it looks once you account for updates and deletes. This is the gap streaming databases fill: Materialize and similar systems consume these change streams and keep SQL views incrementally up to date, so you write a query rather than a consumer.
The failure mode, and it is a serious one: the Postgres replication slot. Debezium reads from a logical replication slot, and Postgres will not discard WAL segments that a slot has not yet confirmed. Stop the connector, or let it crash and not get restarted, and WAL accumulates on the primary. On a busy database that fills the disk in hours, and a full disk on the primary is a production outage caused by a pipeline nobody thought of as production.
If you run CDC against Postgres, these are not optional:
-- How far behind is each replication slot, in bytes of WAL it is pinning?
SELECT
  slot_name,
  active,
  pg_size_pretty(
    pg_wal_lsn_diff(pg_current_wal_lsn(), restart_lsn)
  ) AS retained_wal
FROM pg_replication_slots
ORDER BY pg_wal_lsn_diff(pg_current_wal_lsn(), restart_lsn) DESC;
Alert on retained_wal crossing a threshold and on active = false for any slot that should be running. Postgres 13 and later also support max_slot_wal_keep_size, which caps how much WAL a slot may pin and invalidates the slot instead of filling the disk. Losing a connector and having to resnapshot is a bad afternoon. Losing the primary is a bad quarter.
Two more things to plan for before you turn CDC on: the initial snapshot reads the entire table, which on a large table is hours of load you should schedule rather than discover, and schema changes propagate downstream, so an ALTER TABLE becomes a compatibility question for every consumer. That is what a schema registry is for.
5. Event-driven microservices
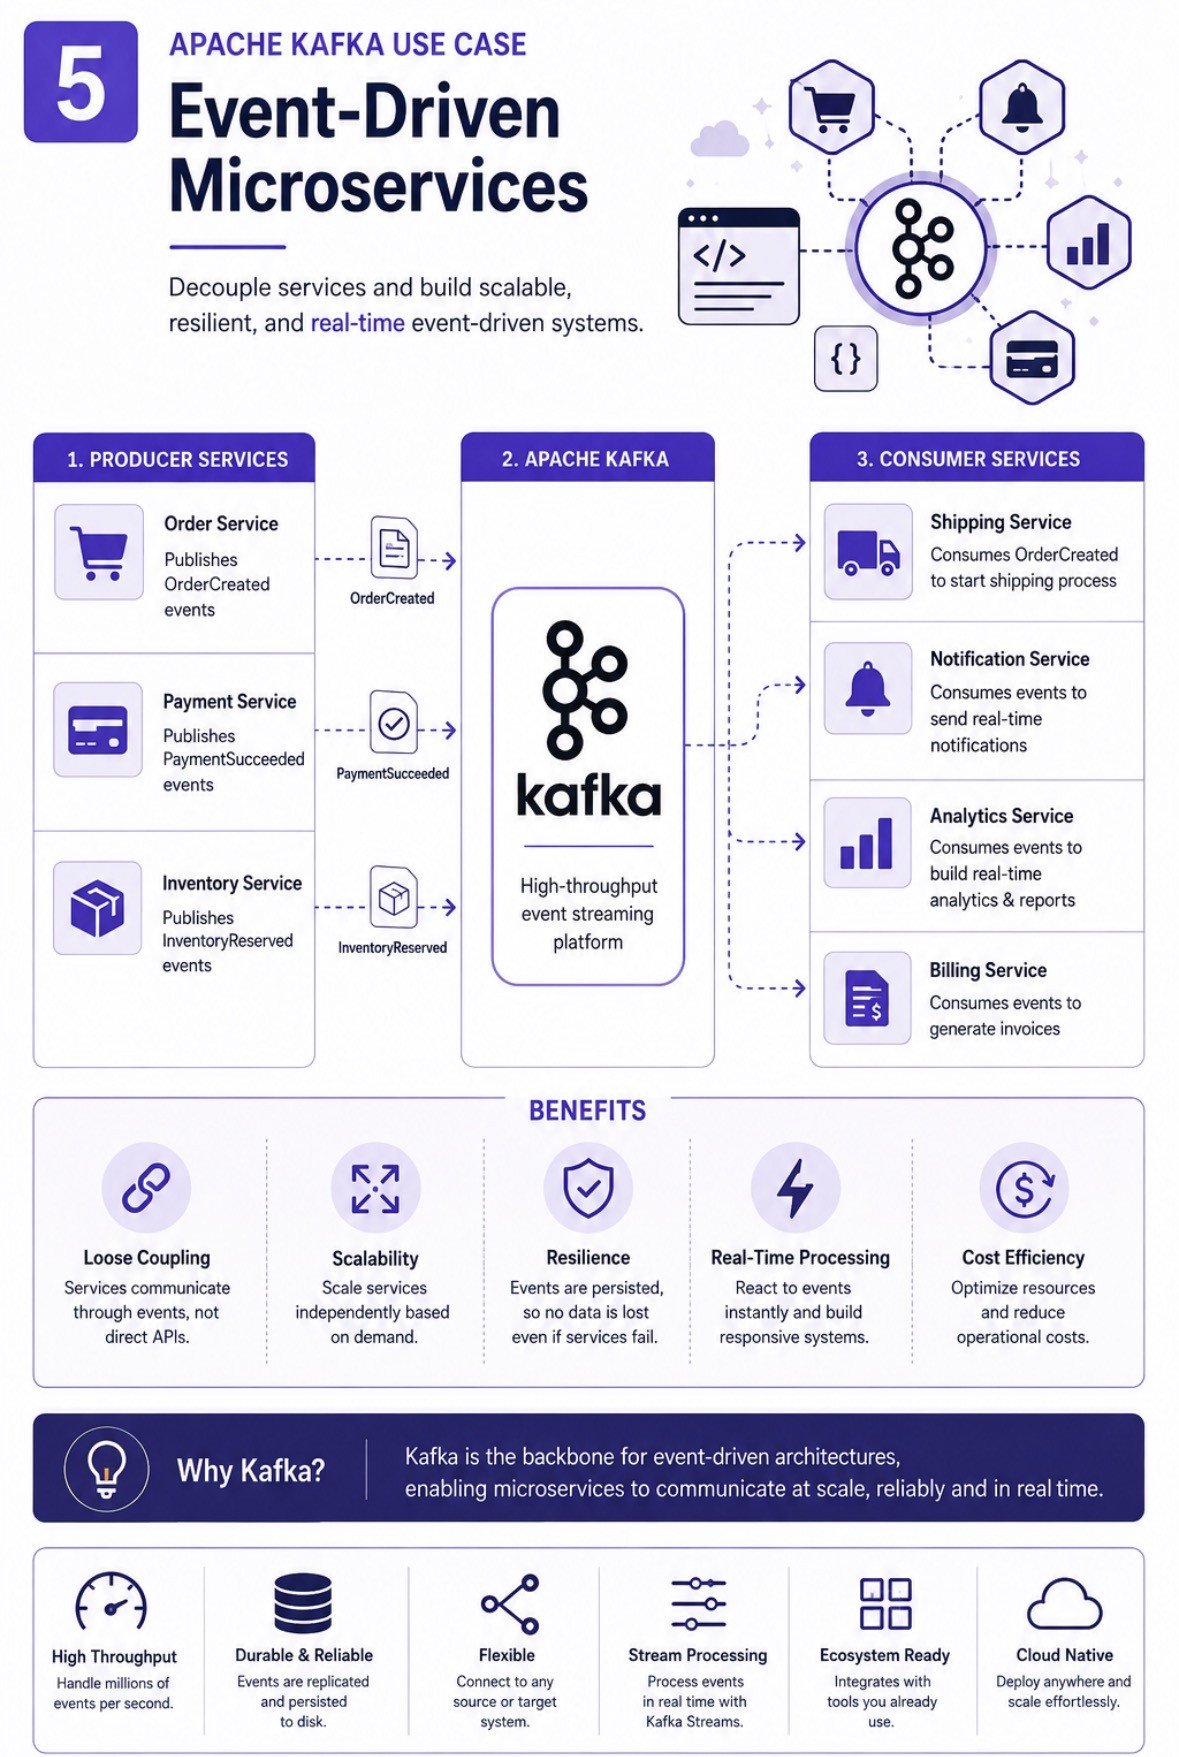
Order, payment and inventory services publish events. Shipping, notifications, analytics and billing consume them. Adding a consumer requires no change to any producer, which is the property everybody wants.
It is a real benefit. The synchronous version of this diagram is a service calling four others and being as available as the least available of them.
The failure mode: the decoupling is narrower than it looks. You have removed the runtime coupling and replaced it with a schema coupling plus eventual consistency, and the second one changes how the product behaves. After OrderCreated is published, there is a window where the order exists and shipping does not know. Usually milliseconds. Occasionally, when a consumer group is rebalancing or a consumer is lagging, considerably longer. Any UI that reads its own write immediately after will show a user something that looks broken.
Three things worth deciding up front rather than during an incident:
Key by the entity whose ordering matters. OrderUpdated and OrderCancelled for the same order must land on the same partition or they can be processed out of order. Key on order id.
Consumers must be idempotent. Kafka's exactly-once semantics apply to reads and writes within Kafka and to transactions across Kafka topics. The moment a consumer writes to Postgres or calls a payment API, delivery is effectively at-least-once, and that side effect will occasionally happen twice. Deduplicate on an event id, or make the operation naturally idempotent.
Carry a correlation id on every event. Debugging a synchronous call chain is a stack trace. Debugging a choreography of six services reacting to each other is reading six logs and guessing, unless every event carries the id that ties them together.
6. Event sourcing
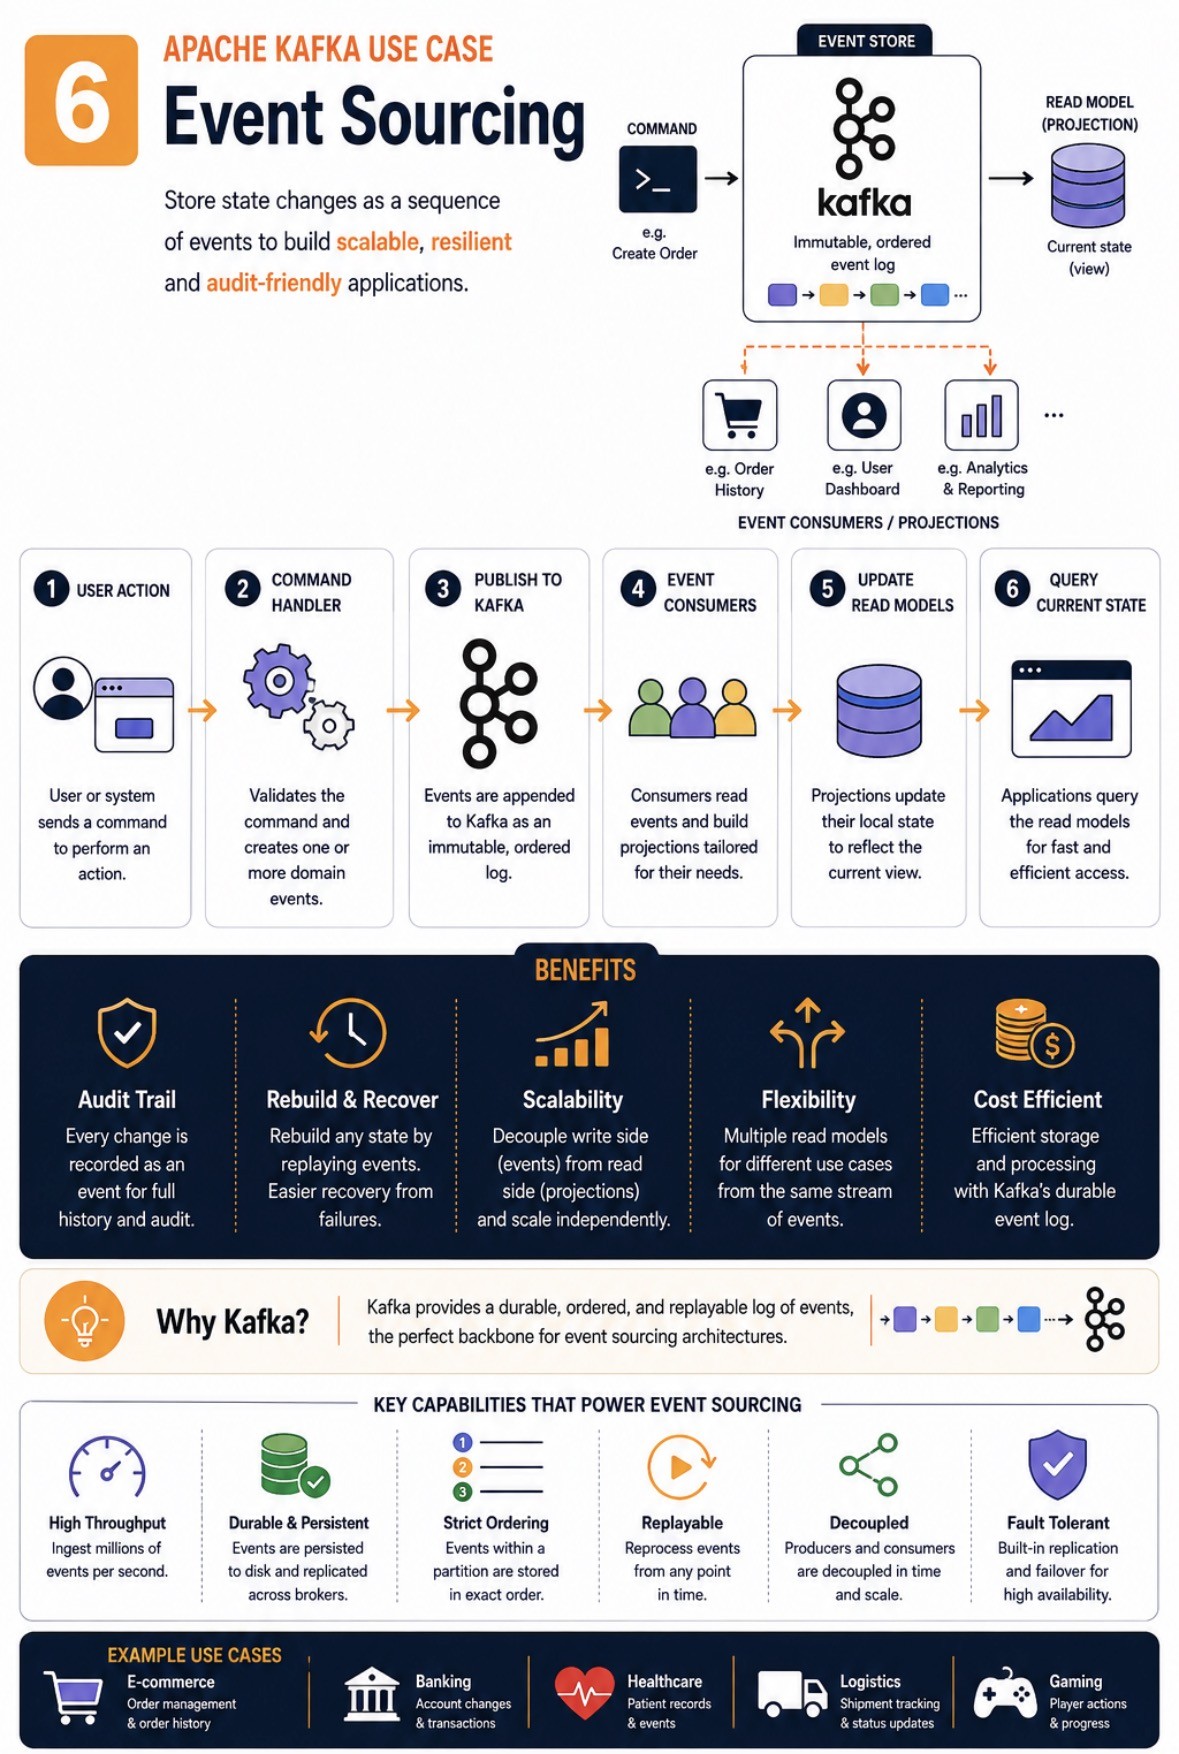
Rather than storing current state, you store the sequence of events that produced it, and derive views from them. The audit trail is complete by construction, and you can rebuild any projection by replaying.
Kafka's log is a natural fit, and this is where replay stops being a nice property and becomes the point: found a bug in how you computed account balances, fix the projection code, replay from the beginning, and the new read model is correct.
The failure modes, because this pattern has several:
Kafka is not a database. There is no "get the current state of order 12345" without either replaying the topic, keeping a compacted topic keyed by id, or maintaining the projection in an actual database and querying that. Most event sourcing setups end up with Postgres holding the read models, and Kafka holding the events.
Replays are not free at scale. Rebuilding a projection from two years of events means reprocessing two years of events. Plan snapshots.
Deletion is genuinely hard. An immutable log is exactly the wrong shape for "delete everything about this person". Log compaction can remove superseded records by key, but an append-only history of what a user did is not something you can surgically edit. The usual answer is crypto-shredding: encrypt personal data per subject and destroy the key, so the events remain and the contents become unreadable. Decide this before you have production data, because retrofitting it means rewriting history you designed to be unrewritable.
When you do not need Kafka
Kafka's cost is not the licence, it is the operational surface: brokers, partitions, consumer group rebalances, schema evolution, connector supervision, and a set of failure modes your team has to learn. That cost is worth paying at a certain scale and for certain properties. Below it, you are paying for a cluster to do what a table would.
Reach for something simpler when all of these are true:
- One producer, one consumer, and no plans for a second
- No replay requirement, because reprocessing history is not a thing you need
- Throughput in the hundreds per second, not the hundreds of thousands
- No ordering requirement beyond what a single worker naturally provides
For those, a Postgres table with SELECT ... FOR UPDATE SKIP LOCKED is a perfectly good queue, runs on the database you already operate, and is debuggable with SQL you already know. SQS gives you the same with no server to run. RabbitMQ handles complex routing better than Kafka does.
Signals that you have genuinely outgrown that, and the cluster starts earning its keep:
- More than one team wants the same stream, and you are tired of adding webhooks
- You need to reprocess history after a bug, and cannot
- The dual-write problem is causing real inconsistency between systems
- A single consumer can no longer keep up, and you need partitioned parallelism
- Sustained throughput where a database-backed queue is spending its time on lock contention
| Postgres table / SQS | Kafka | |
|---|---|---|
| Consumers per message | One | Any number, independently |
| Replay history | No | Yes, that is the design |
| Ordering | Simple, single worker | Per partition, by key |
| Throughput ceiling | Thousands/sec | Millions/sec |
| Operational cost | Nearly none | A real, ongoing commitment |
Summary
| # | Use case | The real reason it works | Watch out for |
|---|---|---|---|
| 1 | Log analysis | Absorbs backpressure when the sink dies | Retention sized for the average, not the incident |
| 2 | Real-time ML | Features fresh enough to be about now | Training and serving skew |
| 3 | Monitoring and alerting | Patterns across events, not gauges | Late events landing in the wrong window |
| 4 | Change data capture | Removes the dual-write problem | Replication slots filling the primary's disk |
| 5 | Event-driven microservices | Add consumers without touching producers | Eventual consistency, and at-least-once side effects |
| 6 | Event sourcing | Complete history, rebuildable views | No point lookups, and deletion is hard |
The pattern across all six is that Kafka is worth it when you need the log properties: many independent readers, replay, and durability of an ordered history. When you only need to hand a job to a worker, it is a cluster you have to keep alive for no return.
FAQ
Is Kafka a message queue?
Not really, and the difference matters. A queue removes a message once it is consumed. Kafka appends to a log, keeps it for the retention period, and lets each consumer group track its own position. That is why replay works and why "the message was consumed" is not a thing Kafka tracks for you.
Does Kafka guarantee ordering?
Within a partition, yes. Across a topic, no. Messages with the same key go to the same partition, so choosing the key is choosing what you get ordering on. If your design assumes global ordering, it will work in staging with one partition and break the first time you scale out.
Is exactly-once delivery real?
Within Kafka, yes, using idempotent producers and transactions across topics. End to end into an external system, no. Once a consumer writes to a database or calls an API, you are in at-least-once territory and need idempotent consumers. Treat "exactly-once" as a Kafka-internal property, not a promise about your sinks.
Can I use Kafka as my database?
For an ordered history, yes. For querying current state, no. There is no index and no point lookup. Compacted topics give you the latest value per key, which is closer, but most systems keep the read models in a database and the events in Kafka.
How many partitions should a topic have?
Enough that your maximum consumer parallelism is not capped, since one partition can be read by only one consumer in a group, and few enough that you are not carrying overhead for nothing. Partitions are easy to add and impossible to remove, and adding them changes key-to-partition mapping, which breaks ordering for existing keys. Start with a number you can justify and leave headroom.
What about Redpanda, Pulsar or a managed service?
Every pattern here is about the log abstraction, not the implementation, so they all apply to Kafka-compatible systems. Managed services remove most of the operational cost that the last section warns about, which genuinely moves where the "is it worth it" line sits.
Try it hands-on
Run the commands from this article in the browser. Nothing to install.
Message Queue Simulator
Visualize how message queues work across Kafka and RabbitMQ patterns. Explore producers, brokers, topics, partitions, exchanges, queues, consumer groups, lag, rebalancing, backpressure, ordering, and dead letter queues.
Microservices Architecture Simulator
Design and deploy microservices. See communication patterns, handle failures, and scale independently. Learn when to use microservices and understand the trade-offs.
We earn commissions when you shop through the links below.


Svix
Webhooks as a service
Svix Dispatch sends your webhooks for you: retries with exponential backoff, signed payloads, idempotency keys, and a delivery log your customers can see.


Atomsized
AWS platform engineering and GitOps
Design and automation for reliable AWS and Kubernetes platforms, safer delivery workflows, and preview and UAT environments your engineers can understand and own.

DigitalOcean
Cloud infrastructure for developers
Simple, reliable cloud computing designed for developers

DevDojo
Developer community & tools
Join a community of developers sharing knowledge and tools

SMTPfast
Developer-first email API
Send transactional and marketing email through a clean REST API. Detailed logs, webhooks, and embeddable signup forms in one dashboard.

QuizAPI
Developer-first quiz platform
Build, generate, and embed quizzes with a powerful REST API. AI-powered question generation and live multiplayer.
Want to support DevOps Daily and reach thousands of developers?
Become a SponsorTags
Found an issue?
Related Posts
Also worth your time on this topic
Getting a Row Change Out of Postgres Without Dual-Writing
Your service writes to Postgres and publishes to Kafka, and one day those two disagree. The fix is to make the database the only writer and read changes from its log: the outbox pattern, logical decoding, and the replication-slot failure mode that quietly fills your primary's disk, demonstrated live with real numbers.
Microservices Observability with OpenTelemetry
Implement comprehensive observability for microservices using OpenTelemetry for distributed tracing, metrics, and logging across multiple services.
140 minutes
AWS Well-Architected Review Checklist
Comprehensive checklist based on AWS Well-Architected Framework covering operational excellence, security, reliability, performance efficiency, cost optimization, and sustainability.
120-180 minutes